Custom Graphs
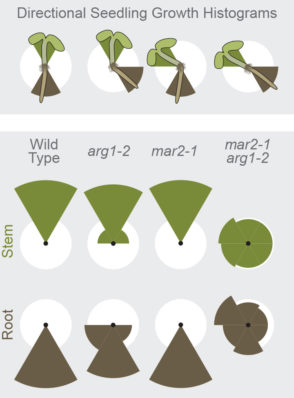
Seedling Directional Growth Graph
Designer: Kate Baldwin
Researcher: Dr. Patrick Masson, Professor of Genetics, University of Wisconsin, Madison
A role for the TOC complex in Arabidopsis root gravitropism.JP Stanga, K Boonsirichai, JC Sedbrook, MS Otegui, PH Masson.Plant Physiol. 2009 Apr;149(4):1896-905. doi: 10.1104/pp.109.135301.
Software: Adobe Illustrator
Plants sense gravity and the stems of seedlings generally grow up and the roots grow down. The Masson Lab wanted to present data showing that a new Arabidopsis double mutant failed to grow with the normal orientation relative to gravity. Because the new double mutant plants grew at completely random angles, it was non-descriptive to average the angle of growth (non-normal distribution). A regular histogram was also not ideal because zero degrees is the same as 360 degrees.
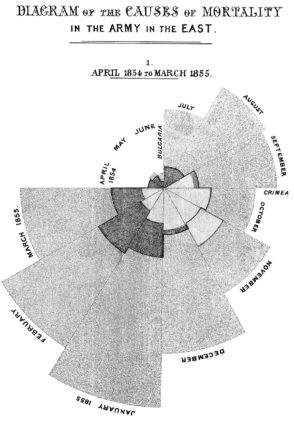
Inspired by the seasonal mortality graphs of Florence Nightingale, we developed a new type of graph for this data where the area of the wedge represents the portion of seedlings that grew in that direction. Based on the raw data, I used simple geometry to calculate what area each triangle wedge should have and prepared the images in Adobe Illustrator. Because each histogram ‘bin’ directly corresponds to the angles included in that bin, few labels are needed and it’s intuitive to the viewer.
I choose green and brown for the stem and root data to instinctively match those with the colors of the plants
Publication Graph Style Standardizing
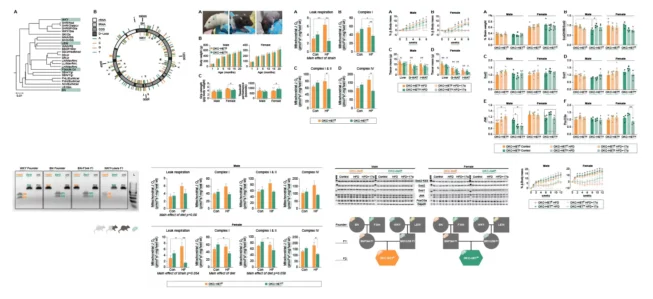
Matching, consistent, figures for the Wanagat Lab and a conglomerate of mitochondrial researchers.
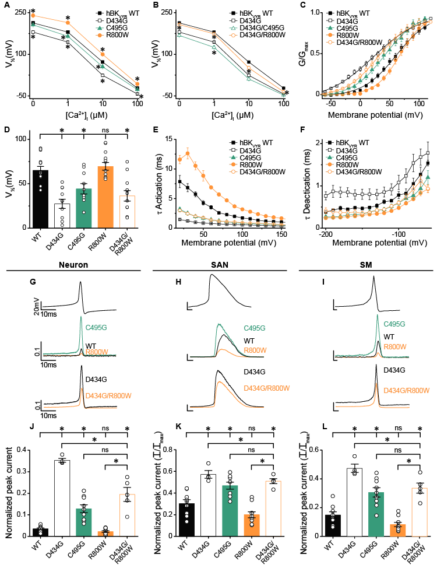
Perfectly scaled, accurate graph formatting following best practices for this paper for the Meredith Lab.
Project posts about Graphs:
Framing Data with Visualizations
Consistency in many figures

Graphs showing insufficient medical Oxygen in Africa
- 1
- 2
Kate Baldwin


