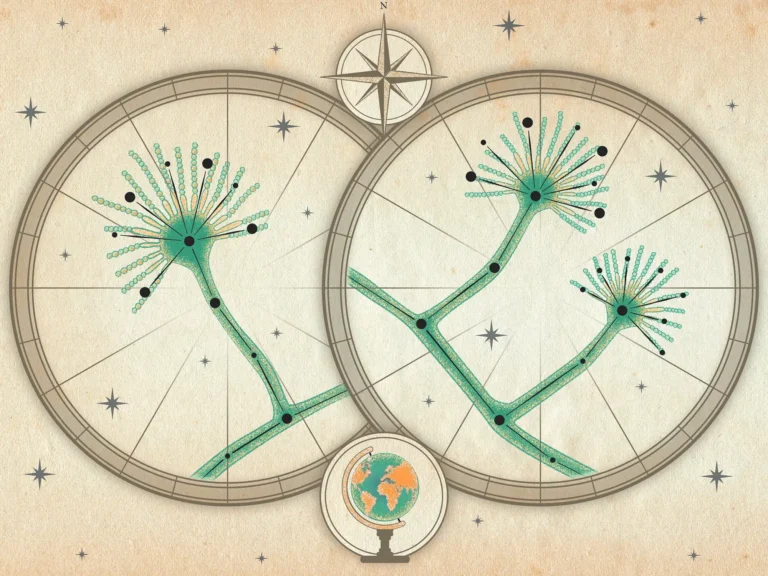
Cover of Nucleic Acids Research
Drawn in Adobe Illustrator
Drawn in Adobe Illustrator
A big grant is funded!
Diagram explaining a new hypothesis as well as some graph formatting.
A methods diagram including the n-numbers for each measurement taken.
Different layers of the skin change in different ways with aging.
A cell-type diagram of bacterial symbiosis with plant roots for a single-cell transcriptome paper.
A molecular biology flow chart with icons
I drew this graphical abstract in Adobe Illustrator.
A journal cover showing Bacteria working hard in a factory to fix nitrogen, in symbiosis with plant roots.
Diagram for a graphical abstract for Aging Cell.