Diagram for new hypothesis of aging
Diagram explaining a new hypothesis as well as some graph formatting.
Diagram explaining a new hypothesis as well as some graph formatting.
Dos and Do Nots of proposal figures.
A methods diagram including the n-numbers for each measurement taken.
Different layers of the skin change in different ways with aging.
A cell-type diagram of bacterial symbiosis with plant roots for a single-cell transcriptome paper.
I drew this graphical abstract in Adobe Illustrator.
Diagram for a graphical abstract for Aging Cell.
Graphical abstract for tidy short paper from the Wanagat lab,.
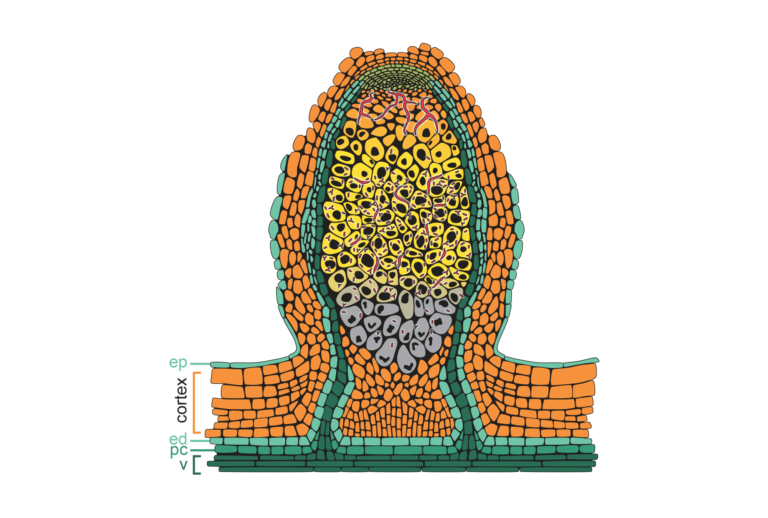
A figure for a review about root nodule formation.
Methods diagram for a wheat experiment